Mapping the Cape Town floods: what 316 reports showed
In May 2026 a community network mapped Cape Town's floods report by report. What 316 verified submissions revealed about the damage the headlines kept missing.
Between 13 and 19 May, water moved through Cape Town’s townships and informal settlements faster than help could. The headlines counted the storm. They didn’t count the wet mattresses, the roofs sitting inside living rooms, or the children who couldn’t get to school because the road had become a river. So our FOONA field collectors did — one report at a time.
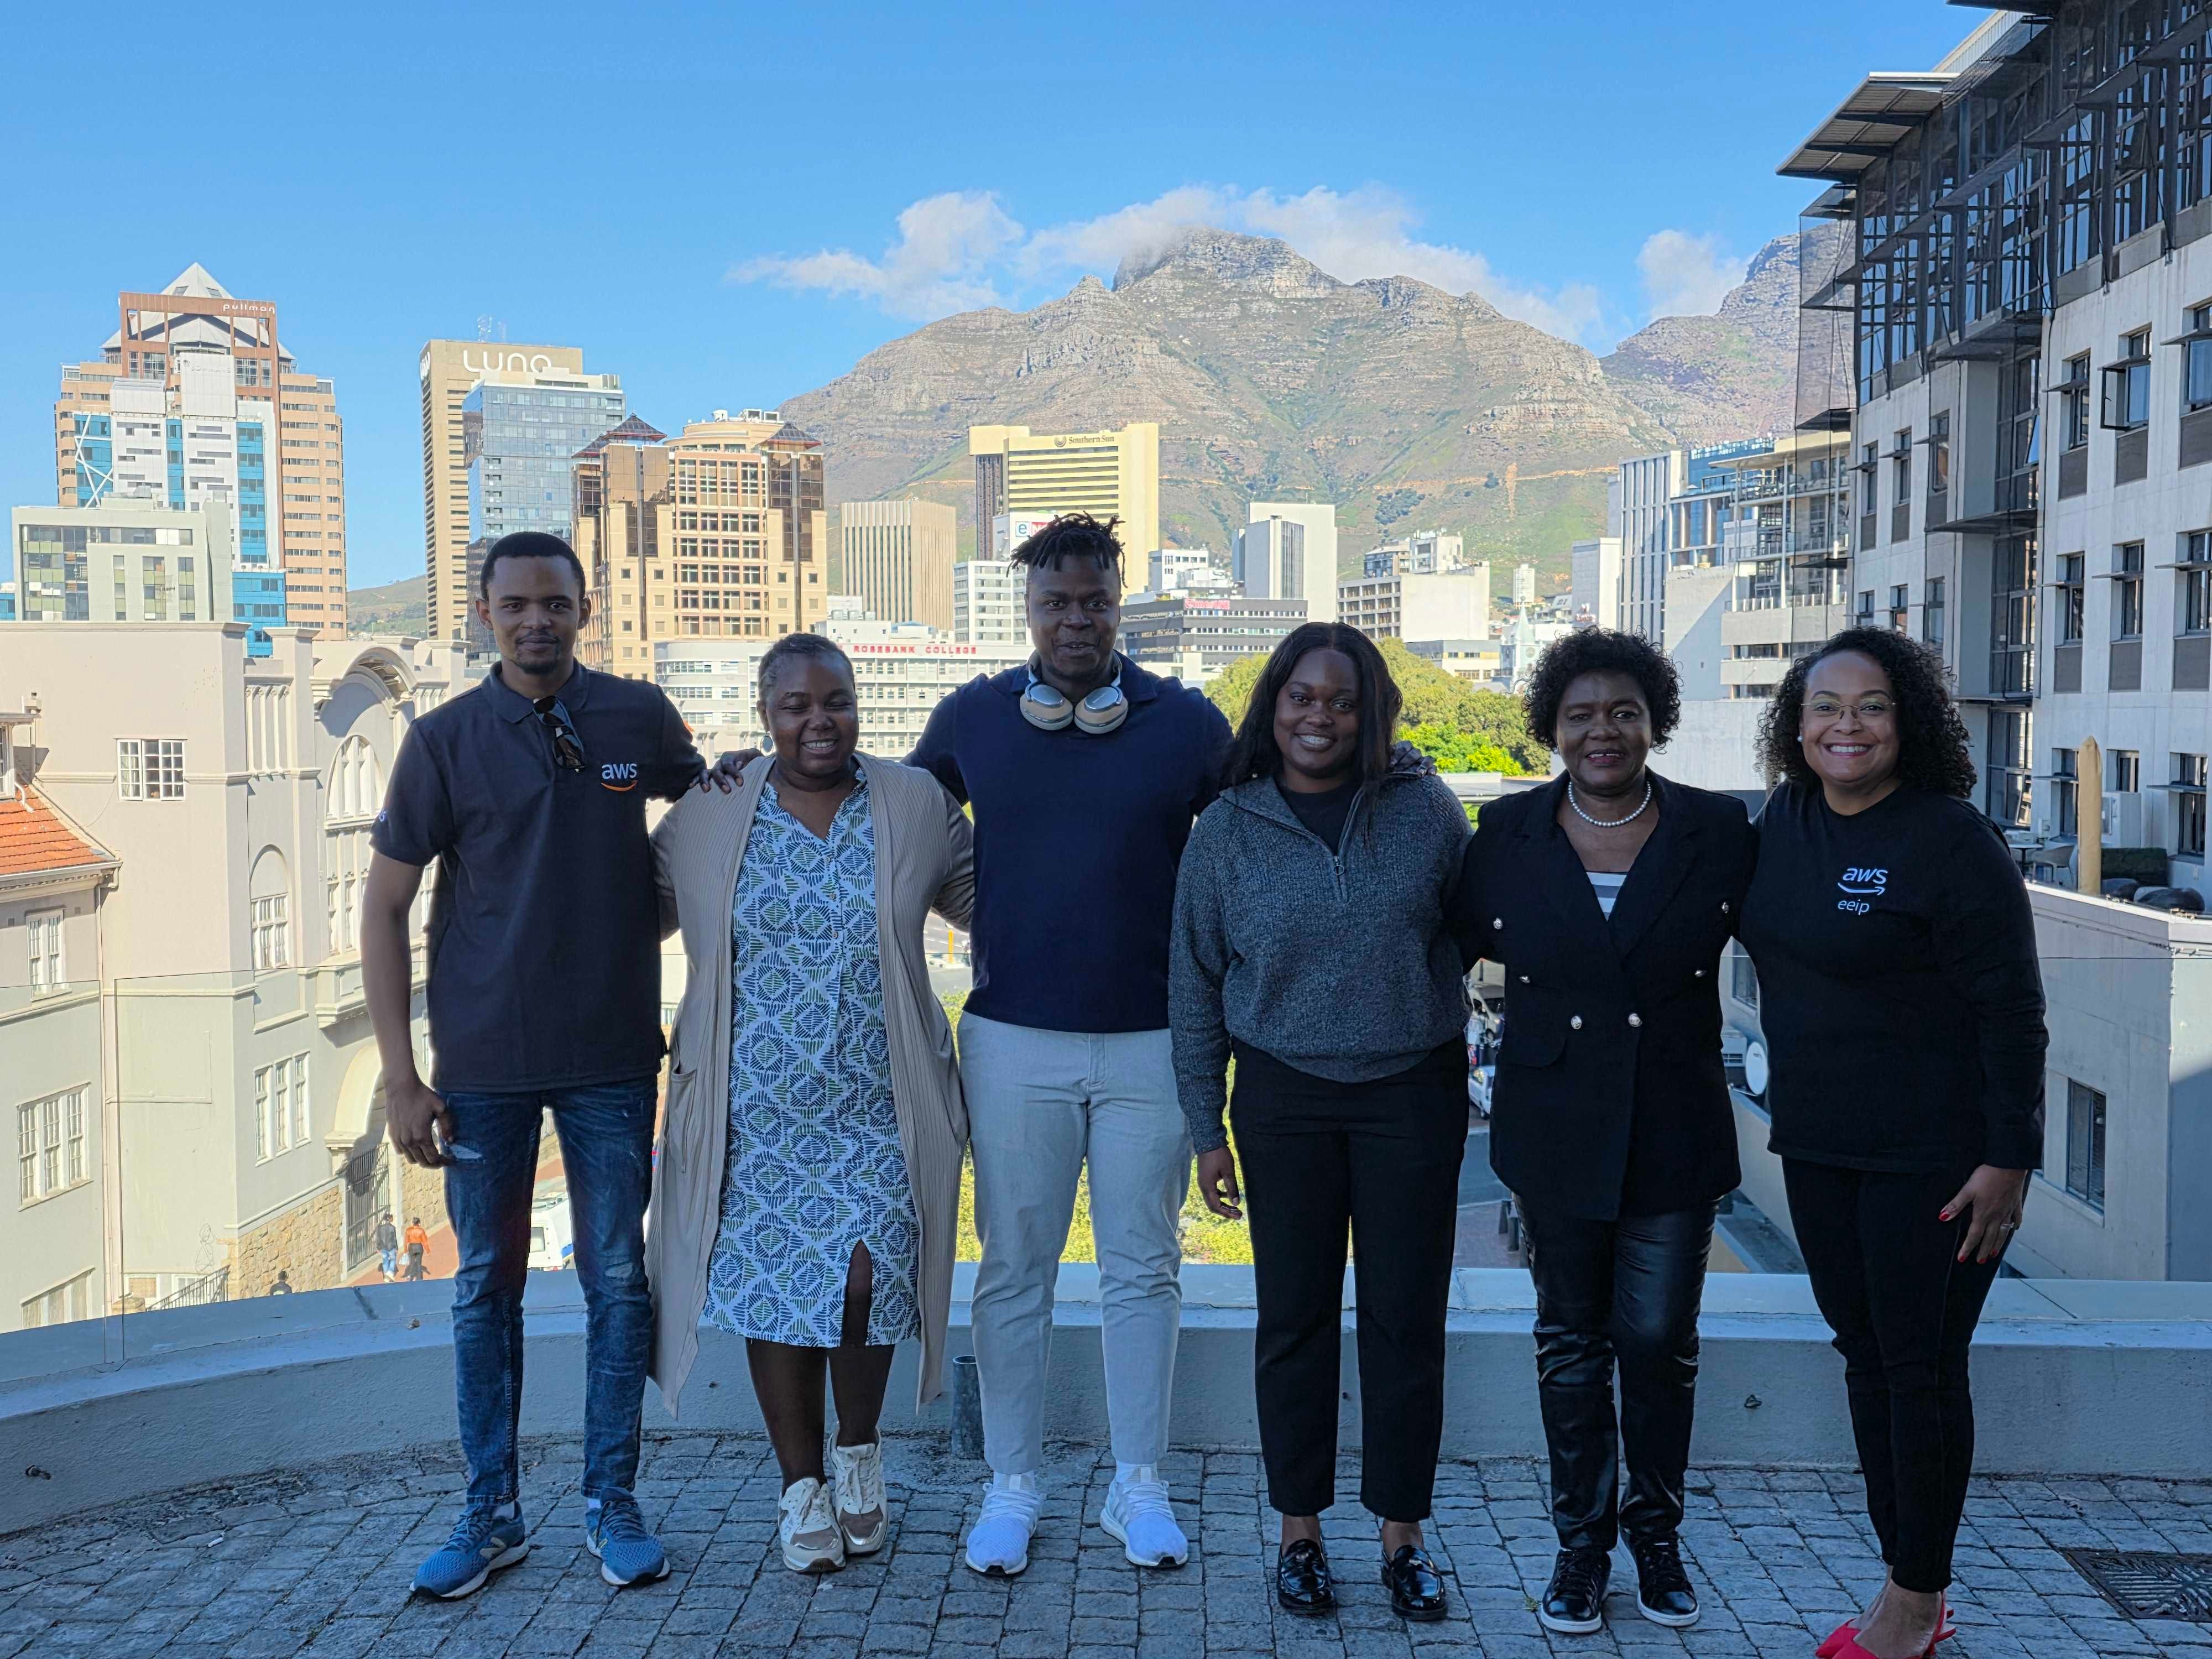
FOONA is the same community network that verifies placements for us on a normal week. When the floods hit, that muscle turned to something else: rapid, community-powered damage mapping. A collector walks up, photographs what they see, drops a location, describes the situation, and sends it over WhatsApp. Our team reviews and verifies each one. In seven days, 40-odd contributors filed 316 reviewed reports across 13 community clusters. The point was never volume for its own sake — it was to make sure support could follow evidence instead of assumption.
What the reports showed
Displacement dominated, but the long tail matters just as much: recovery efforts already underway, broken roads and bridges, and the quiet infrastructure failures — water, sanitation, electricity — that outlast the weather.
“People are struggling to sleep, their beds are wet because the water came inside their houses.”
Site B, Khayelitsha
Where the damage concentrated
The reports clustered where the ground was lowest and the drainage weakest — the same neighbourhoods that rarely make the flood coverage at all. Nyanga, Philippi, Samora Machel and Gugulethu together carried the heaviest load, with Mfuleni and the Langa corridor close behind.
“The whole roof came inside the house. The whole roof is inside the house. The damage is very bad.”
Mfuleni / Waterways
What the headlines missed
The acute story — homes flooded, people displaced — is only the part that photographs well. Underneath it sat a slower emergency the coverage never reached: wet homes long after the rain moved on, blocked drains and standing water, sewage backing into toilets, children kept out of school, shifted poles and live-electricity risk, wind-torn roofs, and traders who lost the little stock that was their whole income. Structured, verified reporting is how those quieter losses become visible enough to act on.
Why this is the same muscle
None of this required a new capability. It required the one we already have: people who know their own streets, a rubric for what counts, and a review step that turns a photo into a data point you can trust. That is exactly how ground truth beats inference on a normal week — local knowledge, structured. The floods just made the stakes plain. When the measurement is honest and the people collecting it are from the place being measured, the map tells you where help actually needs to go.